
I wrote about this five years ago, in my pre-blog days, time to revisit and share with new readers.
Today, we’re going to look at a complex topic, how diversification helps reduce your risk when investing in stocks. I’m going to use an analogy, coin flipping, to simulate stock returns in a way that should help simplify the concept. We’re going to start with a simple idea, a game in which you flip a dollar coin and if you bet right, you gain 30 cents, if wrong, you lose 10 cents. It’s an exaggerated way to simulate the stock market, either +30% or -10% on a dollar bet.
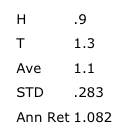
The above summarizes the results for one flip. For sake of easy math, -10% is listed as .9, and +30% is 1.3. The average is 1.1, a 10% return, not too far from reality, and a simple standard deviation calculation shows .283 quite a bit higher than the S&P standard deviation. For annualized return I take the geometric mean, the square root of .9 *1.3. Bear with me. It gets better. The next step is to split the bet. After all, the odds are in your favor, right?
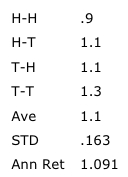
You can see that a loss requires two heads, a one in four event. Half the time you will get the average 10% return, and a one in four chance at 30%. The important thing to note is that while the average didn’t rise, the standard deviation dropped quite a bit. And the geometric mean of the 4 results gives us an annual return of 9.1%. We can continue this process following the pattern of Pascal’s Triangle
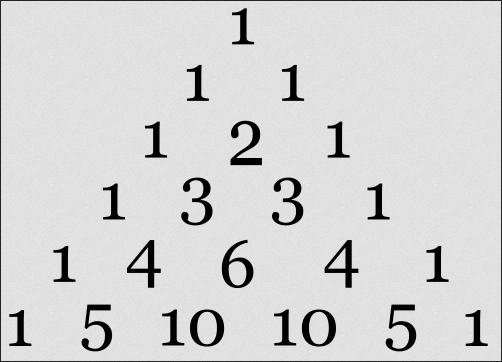
The third row here helps us understand the three coin scenario, of 8 possible outcomes, one is all heads, three is two heads one tail, etc, a pretty cools chart to understand the odds involved.
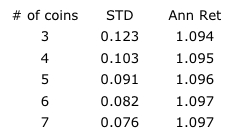
The math gets a bit more complex with each added coin, but it’s easy to see that the more flips the bets are spread across, the lower the standard deviation, in other words the results cluster more closely to the average, and the geometric mean also improves in the process. That’s my thought for today, the math of stock diversification is similar, yet far more complex to explain as each stock has its own set of risks. I hope this made the process a bit easier to understand.
Joe,
Great post. I especially liked the reference to Fibonacci. It’s always good to see math you learned in HS used in investing!
Hmm, Fibonacci? I know his sequence hides nicely in the triangle above, but I didn’t mention him. Maybe you were reading my mind as I wrote this, I was thinking to sneak a reference in.
The coin analogy is very clear – hadn’t thought of it like that before. Great post!
Does the geometric mean level out at 1.097 or will it climb incrementally further? Very interesting post.
Yes, it appears to level out at the 9.7%. Keep in mind, CAGR will always lag the Average Return, especially when there are negative years in the mix.