
Every so often, it’s time to look at the terms that we use when discussing financial matters. I’d like to take a look at the terms ‘Average Return’ vs ‘Compound Annual Growth.’ These two phrases sound similar, yet the results can be quite different.
The math isn’t complex, so we’ll start with a simple example. Two years, the first year is up 20%, the second, down 20%. It’s pretty obvious that the average of +20 and -20 is zero, no surprise there. But the compound annual return is a bit different, as 1.2 * .8 = .96 and this results in -4% over a 2 year period or a true return of -2%/yr CAGR. I know that too many numbers make your eyes glaze over, so an image:
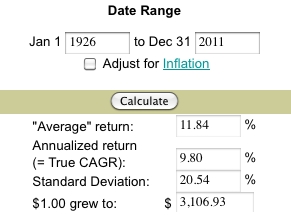
This comes from the site Money Chimp, where you can check the market return between the end of two years, and adjust for inflation if you wish. It’s one thing to see random numbers trying to illustrate a point, and quite another to see how it would actually impact your money using real data. You can see that the Compound Annual Growth of “True CAGR” as the Chimp calls it, lags the Average by a full 2%. This is a result of the volatility of returns, as in my exaggerated example, a -20 cannot simply be averaged with a +20.
I don’t know what the market will do in the future. No one can know, really. But I do know how to look at the past, and to look at this specific period, 1926-2011, and suggest it returned 12% is simply incorrect. Had we actually seen 85 years of 11.84%, the result would have been a $13,513 return, four times the final return. Lest you think that the difference of 2% was a result of the 85 year time horizon shown, head over to the site and just enter 2001 and 2010 as the beginning and final years. You’ll learn the disparity is formed by both volatility as well as time, so even short periods are affected.
I was recently reminded of Dave Ramsey’s 12% ongoing market claim, and re-read his article The 12% Reality. In his article Dave confuses simple with compound average and stands his ground. He even discusses the so called Lost Decade; From 2000–2009, the market endured a major terrorist attack and a recession. S&P 500 reflected those tough times with an average annual return of 1%. Last I checked, ten years of 1% returns would grow your money at least 10%, no? The calculator shows us a True CAGR of -.99% for a cumulative loss of 9% over the decade. Let me spell that out – You started the decade with $10,000, and ended with $9,100, a bit less after expenses. Dave’s claim that you’d have $11,000 or so misses the true number by 20% for the decade.
I’ve always loved math, and find that it’s tough to argue with facts. Next time someone starts quoting market returns, remember, knowledge is power, and you’re now armed with the knowledge to help you understand the numbers and educate others.
Either way, the more money you save and allow to compound, the better off you are in the long run. Compound interest is the most powerful force in the university, as Albert Einstein once said.
Agreed that one should save ‘more,’ but expectations are important. Plan for 12% returns and get 8%, and you’ll approach retirement pretty poor. Plan for 8%, and see 10-12% over time, and you can adjust savings as retirement approaches, or retire early.
The Einstein quote? Snopes offered their opinion, and believe it to be made up.
Every 10 years or so markets seem to go through these phases of slow growth or loss. I think the US economy is still very strong and investing your money in the S&P500 is a very good hold for now. Since 2009, the S&P500 has gone up every year. Just in the 1st Qtr this year, it has gone up 9%.
David – understood, I’m not forecasting market returns, just looking at past performance claims with a bit of a magnifying glass to explain what we’ve actually seen. That 2% difference shouldn’t be ignored.
Compound growth is a really amazing phenomenon. Very glad that my parents had me allow a small sum to compound when I was younger, just as an experiment.
A very general and rough guide:
compounded return = average return – 0.5 * (standard deviation)^2
= .1184 – 0.5 * (.2054)^2
= .0973
Pretty close to the actual .098.
The S&P returns you give for the Lost Decade: do they include dividends? Thanks.
Good question. Yes, the site I used (MoneyChimp) shows true total returns, dividends included. If you wish, there’s an option to adjust for inflation as well.
Obviously these comparisons help to me to know the exact meaning for both average return and compound annual growth.