
The New York Times offers an interactive page offering beautiful graphs of the change in home prices in different parts of the country.
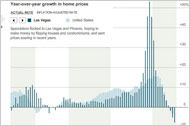
Clicking on the image above will take you to the Times’ site where you can view the changes in the region you wish.
Joe