The May 2 Issue of The Week magazine had an interesting article titled “The Global Food Crisis”. While I held the belief that the move to bio fuels was the major cause of the recent rise in food prices, this article gave me a better view of the big picture. While bio fuel demand is one of the causes, six years of drought in Australia, flooding in Argentina and other weather related events added to the crisis. What I missed completely was the shift in diet within China. The average Chinese person now consumes 110 pounds of meat per year, up from 44 pounds two decades ago. It takes 10 pounds of grain to produce one pound of pork and 20 pounds of grain to produce a pound of beef, so it would seem that the rise of the Asian middle class was a major factor in the current crisis. This raises new and troubling questions. Can the world shift from being largely vegetarian to omnivore and not create its own ongoing crisis? Perhaps when we realize that bio fuels are a misguided solution to this problem will we get on with the research that will lead toward a lasting solution – the alternate energy provided by solar and wind. Enjoy the holiday weekend.
Joe
{ }
Earlier this week, I talked a bit about the Social Security replacement rate, how much a single person could expect to receive at their normal retirement age. As we discuss trying to make up the difference to enjoy a post retirement income which replaces working income by close to 80% we run into the Social Security tax trap, the fact that for a single person, when half your benefit plus other taxable income exceeds $25,000, the benefits become taxable. So I updated the table a bit.
| Earnings |
Benefit |
Replaced |
$25K-1/2 Benefit |
Gross $$ |
| 20000 |
11349 |
0.57 |
28276 |
706893 |
| 25000 |
12949 |
0.52 |
27476 |
686893 |
| 30000 |
14549 |
0.48 |
26676 |
666893 |
| 35000 |
16149 |
0.46 |
25876 |
646893 |
| 40000 |
17749 |
0.44 |
25076 |
626893 |
| 45000 |
19349 |
0.43 |
24276 |
606893 |
| 50000 |
20949 |
0.42 |
23476 |
586893 |
| 55000 |
21946 |
0.40 |
22977 |
574424 |
| 60000 |
22696 |
0.38 |
22602 |
565049 |
| 65000 |
23446 |
0.36 |
22227 |
555674 |
| 70000 |
24196 |
0.35 |
21852 |
546299 |
| 75000 |
24946 |
0.33 |
21477 |
536924 |
| 80000 |
25696 |
0.32 |
21102 |
527549 |
| 85000 |
26446 |
0.31 |
20727 |
518174 |
| 90000 |
27196 |
0.30 |
20352 |
508799 |
Now we can see the amount of (taxable) income we can have before we hit the range where SS benefits are taxable. We also can see the amount of money needed to generate that income (using the 4% withdrawal rate we’ve discussed in the past). Note: The column “$25K-1/2 Benefit” is increased by $8950, the sum of the standard deduction and exemption for a single person. Of course if you have high enough deductions to file schedule A this will increase further. So, getting back to the discussion of pretax and post tax savings, we are closing in on the gross numbers you can save, pretax, with little risk of either hitting a higher tax bracket at retirement or running into the range where Social Security benefits are taxable. In the next few weeks, I will offer more analysis, along with observation on this scenario for couples.
Joe
{ }
I’ve had more frequent conversations recently regarding a number of financial topics. The pretax vs post tax IRA certainly tops the list along with the required income needed at retirement, both in absolute terms as well as replacement ratio. I thought this would be a good time to discuss how much of that retirement income is expected to come from Social Security. The primary insurance amount (the benefit (before rounding down to next lower whole dollar) a person would receive if he/she elects to begin receiving retirement benefits at his/her normal retirement age) is shown below for those with annual incomes ranging from $20K per year to $90K per year.
| Earnings |
Benefit |
Replaced |
| 20000 |
11349 |
0.57 |
| 25000 |
12949 |
0.52 |
| 30000 |
14549 |
0.48 |
| 35000 |
16149 |
0.46 |
| 40000 |
17749 |
0.44 |
| 45000 |
19349 |
0.43 |
| 50000 |
20949 |
0.42 |
| 55000 |
21946 |
0.40 |
| 60000 |
22696 |
0.38 |
| 65000 |
23446 |
0.36 |
| 70000 |
24196 |
0.35 |
| 75000 |
24946 |
0.33 |
| 80000 |
25696 |
0.32 |
| 85000 |
26446 |
0.31 |
| 90000 |
27196 |
0.30 |
A few observations here: This reflects the benefit an individual would receive, and my comments for tax purposes also reflect one filing single. The way this is calculated, a lower wage earner receives a higher percent of his income at retirement than a higher earner. If we use 80% (not saying I agree or disagree, but 80% keeps popping up) as a target replacement income, the $55K earner will have half of this target covered by Social Security. In my next post, I’ll discuss the Social Security Tax trap, and tie the analysis back to the pretax vs post tax investing decision.
Joe
{ }
The book “Last Chance Millionaire” by Douglas R. Andrew was interesting to me, if only for the lack of depth. It reminded me of the original “Twilight Zone” TV series in this regard – every episode could be summarized in about three sentences or one minute of action, and the remaining 24 minutes was filler.
Mr. Andrew spends the first 200 or so pages making the case that one should always have a mortgage, and it should be as large as possible. Now there’s a premise I’d not want to spend too much time debating, but I’d agree that there are better times to borrow and other times to pay down one’s debt. I am old enough to remember a 30 year fixed rate of 13.5% which, in the 25% bracket is still 10-1/8% after tax. At that rate, I prefer to pay down the mortgage and advise other to follow. With rates below 6%, someone in the 28% bracket has an after tax interest cost of 4.32%. There, I just saved you 200 pages.
He goes on to suggest investing in Indexed Universal Life Insurance. I am on record as being anti-variable annuities, but this product offers a few different twists. The withdrawals are first made against the principal within the account, so no taxes are due. Then with a bit of smoke and maybe a mirror or two, further withdrawals are taken as ‘loans’ against the account, which are then paid back on death.
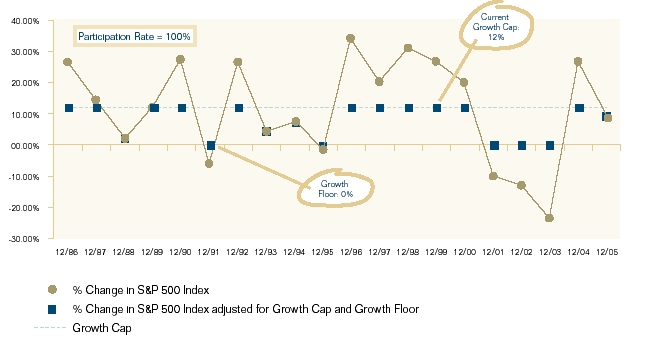
I wanted to find out how the account grows in value and discovered a policy by Pacific Life called “Pacific indexed Accumulator II” which describes the annual crediting. One receives the return of the S&P index (no dividends) with a maximum of 12%, and minimum 0%. So the trade-off appears to be that you give up the dividend (The S&P currently yields about 2.1%) as well as accept a cap of 12% per year, in exchange for a guarantee of no annual losses. I’m still on the fence about borrowing to fund this, but the concept itself has a certain appeal. This chart from the prospectus does a good job illustrating the return you would have gotten over the past 20 years. I thank one of my regular readers for bringing this book and investment approach to my attention.
Joe
{ }
Last September I wrote about a zero interest credit card offer I took advantage of. I took the money and bought a CD, pocketing $1000 interest in 6 months time. I received a few comments and questions, centering around how this would impact my credit score. I offered a chart showing how the score is impacted, in general, but couldn’t say for sure the precise impact of any one action on the score. That would take regular access to the score itself, which through MyFICO, would cost nearly $50/yr. Now, I discovered a free way to have regular access. It seems that WAMU (Washington Mutual) offers such access to their credit card holders. The card has no annual fee, and you just click through a link to see your score. They offer an option to get email notification if your score moves by more than 20 points. Combine this with a regular request for your full credit report, and you have a good plan to monitor your credit health
Joe
{ }
